
Intelligence & Impact
Natural-language access to your supply chain, governed dashboards, and an observatory of real-world outcomes.
Jiraffe Intelligence Lab
Beyond a chatbot: natural-language queries over approved operational records, answered with evidence you can open, check and audit.
Ask Jiraffe
- Parsing intent · commodity, grade, volume, geography, compliance
- Querying approved batch & QA records
- Geospatial check · Petauke district boundary
- Scoring readiness & ranking supply
Retrieving evidence…
| Batch | Source | t | Organic | EUDR | Days |
|---|---|---|---|---|---|
| B-PT-2026-118 | Coop · Petauke East | 14 | 86% | 91% | 21 |
| B-PT-2026-124 | Group · Minga | 9.5 | 83% | 88% | 12 |
| B-PT-2026-131 | Coop · Petauke West | 8 | 81% | 85% | 44 |
Evidence
Illustrative demonstration. Answers are generated by foundation models retrieving approved Jiraffe.ai records (RAG) — results respect role-based permissions and are not presented as proprietary model training.
01
First-party data
Operational records from farms, harvests, QA, batches and workflows — captured in the field through Jiraffe.ai.
02
Retrieval & analytics
Natural-language interfaces, retrieval-augmented generation over approved records, geospatial analytics and predictive models.
03
Evidence & governance
Every answer carries source links, confidence, freshness and an audit trail — filtered by role-based permissions.
The dashboards
A walkthrough of the live product — from a farmer's dashboard to compliance audits, the Virtual Warehouse and financials.

Product walkthrough with demonstration data.
Business intelligence
Supply forecasting, quality & compliance, crop risk, procurement and geography — with filters that stay in sync across charts, tables and maps.
429 t
Forecast supply
+148%
Change over 6M
84%
Batches with QA
12
Sourcing gaps flagged
Illustrative data. Production dashboards use governed datasets with documented definitions.
Impact Observatory
Farmers onboarded
Food processors connected
Aggregators (Nyimba & Chipata)
Districts in Eastern Province
Value chains
Source: Jiraffe.ai, November 2026.
Geographic reach
Districts, provinces and value chains served.
Inclusion
Women and youth participation in connected supply.
Income change
Price realisation and income for participating farmers.
Post-harvest loss
Loss reduction between harvest and processing.
Environment
Restoration, biochar and deforestation-risk measures.
Project evidence
Programme-level outcomes with traceable methodology.
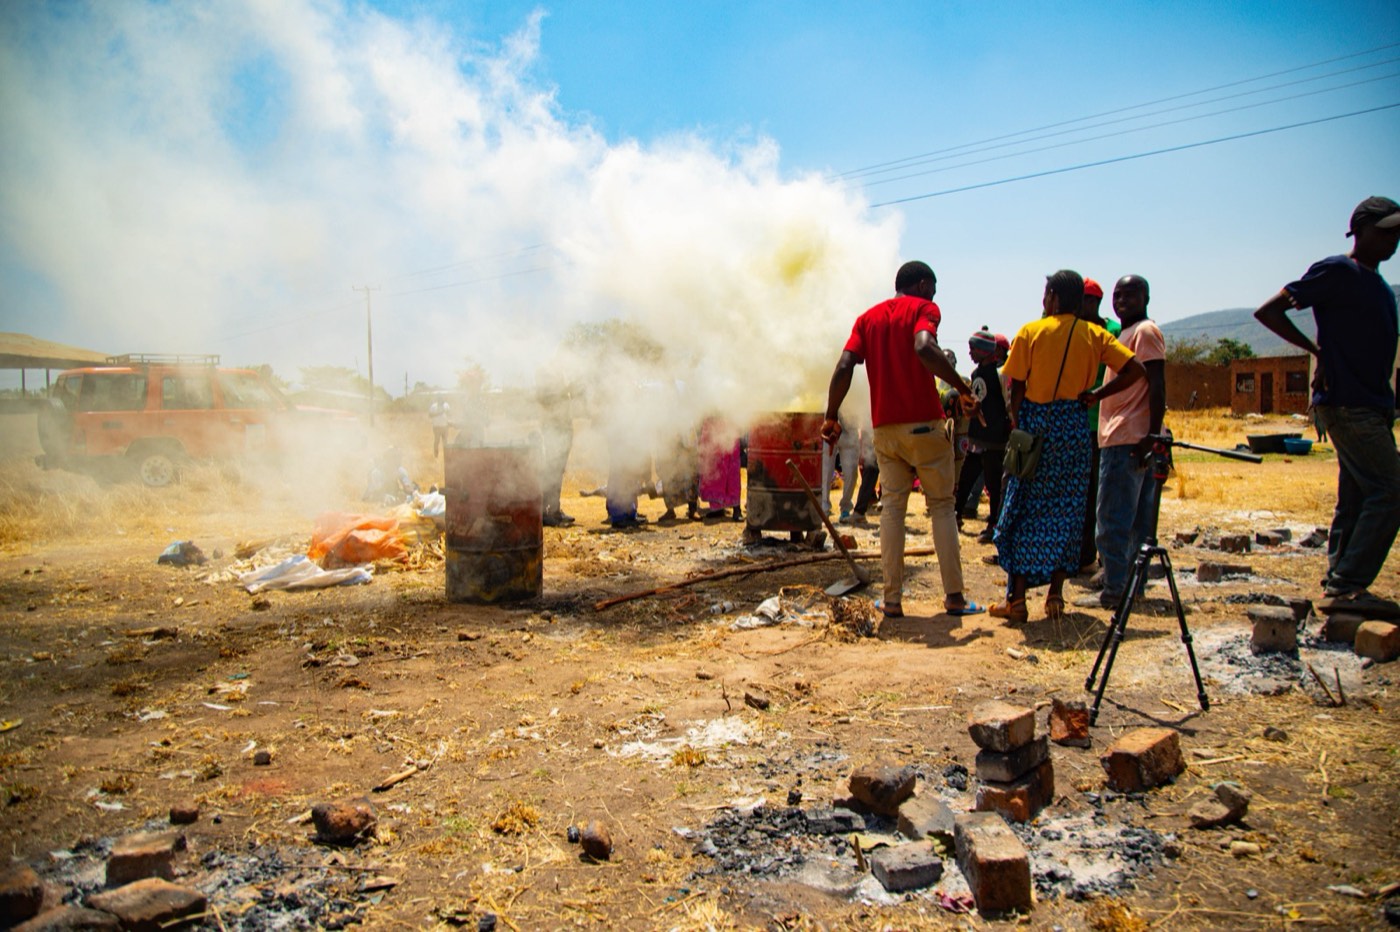
Case study · Eastern Zambia
Pigeon pea + biochar: restoration connected to commercial opportunity.
Better soil starts with pigeon pea and biochar. Jiraffe.ai maps participating farms, documents kiln batches and connects the resulting supply to processors — turning a restoration programme into a dependable commercial pathway.
Implemented with the Landscape Alliance (CIFOR · ICRAF). Methodology & figures available on request.